Birthdays and Holidays
Oliver Thistlethwaite
The purpose of this project is to analyze any possible relationship between birthdays and holidays. We’ll use the R libraries dplyr, ggplot2, lubridate, as well as the Birthdays data set from the mosaicData library.
First we will draw a plot measuring the number of births for each day in our time frame.
DailyBirths <- Birthdays %>%
  group_by(date) %>%
  summarise(total = sum(births))

DailyBirths %>%
  ggplot(aes(x=date, y = total)) + geom_point()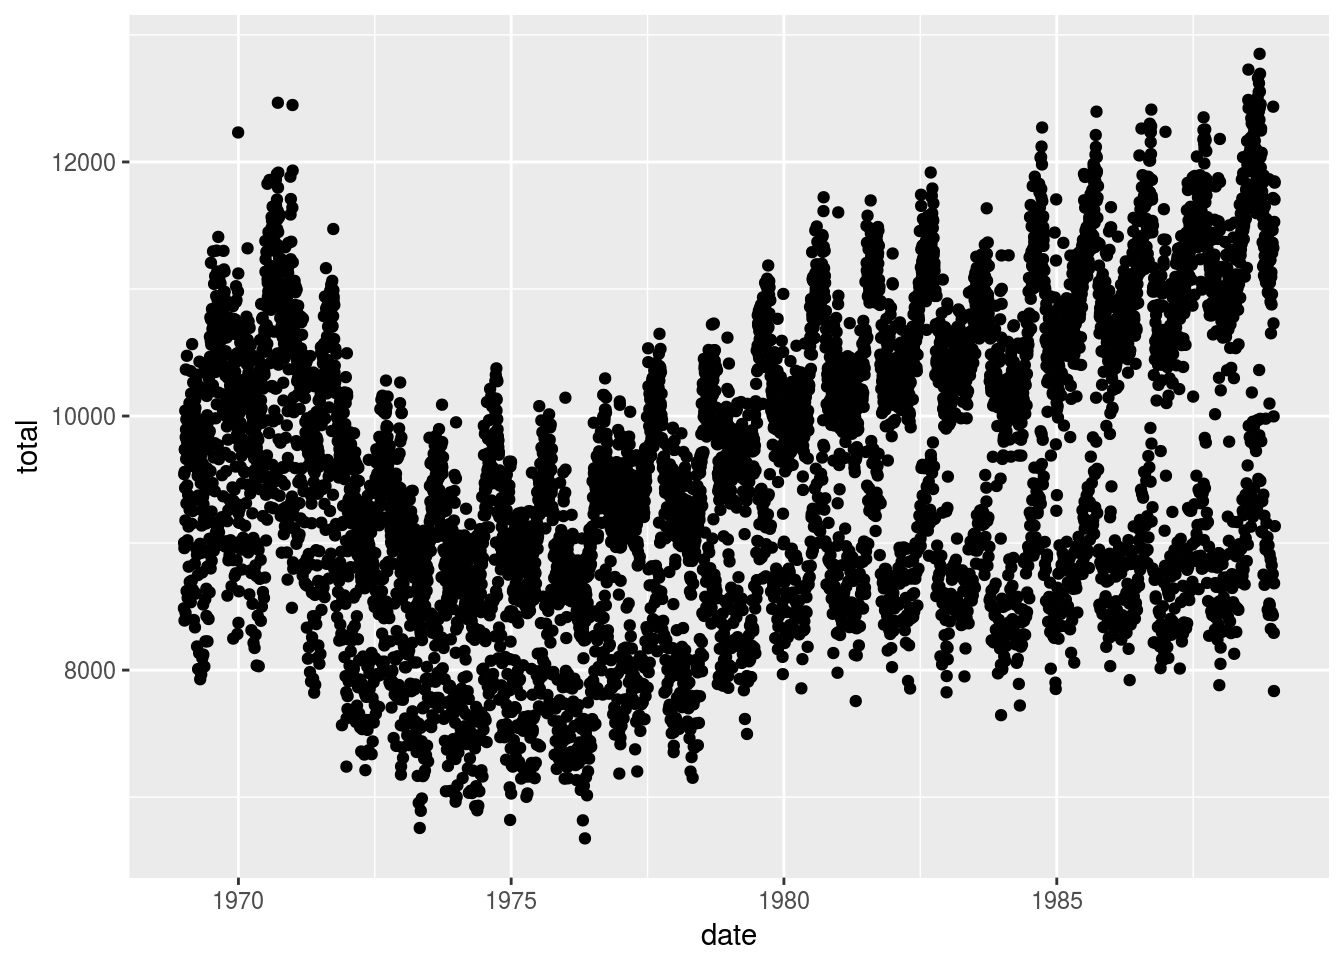
Next we draw a similar plot, only this time measured by week of the year.
WeeklyBirths <- Birthdays %>%
  mutate(week = week(date)) %>%
  group_by(week) %>%
  summarise(total = sum(births))

WeeklyBirths %>%
  ggplot(aes(x=week, y = total)) + geom_point()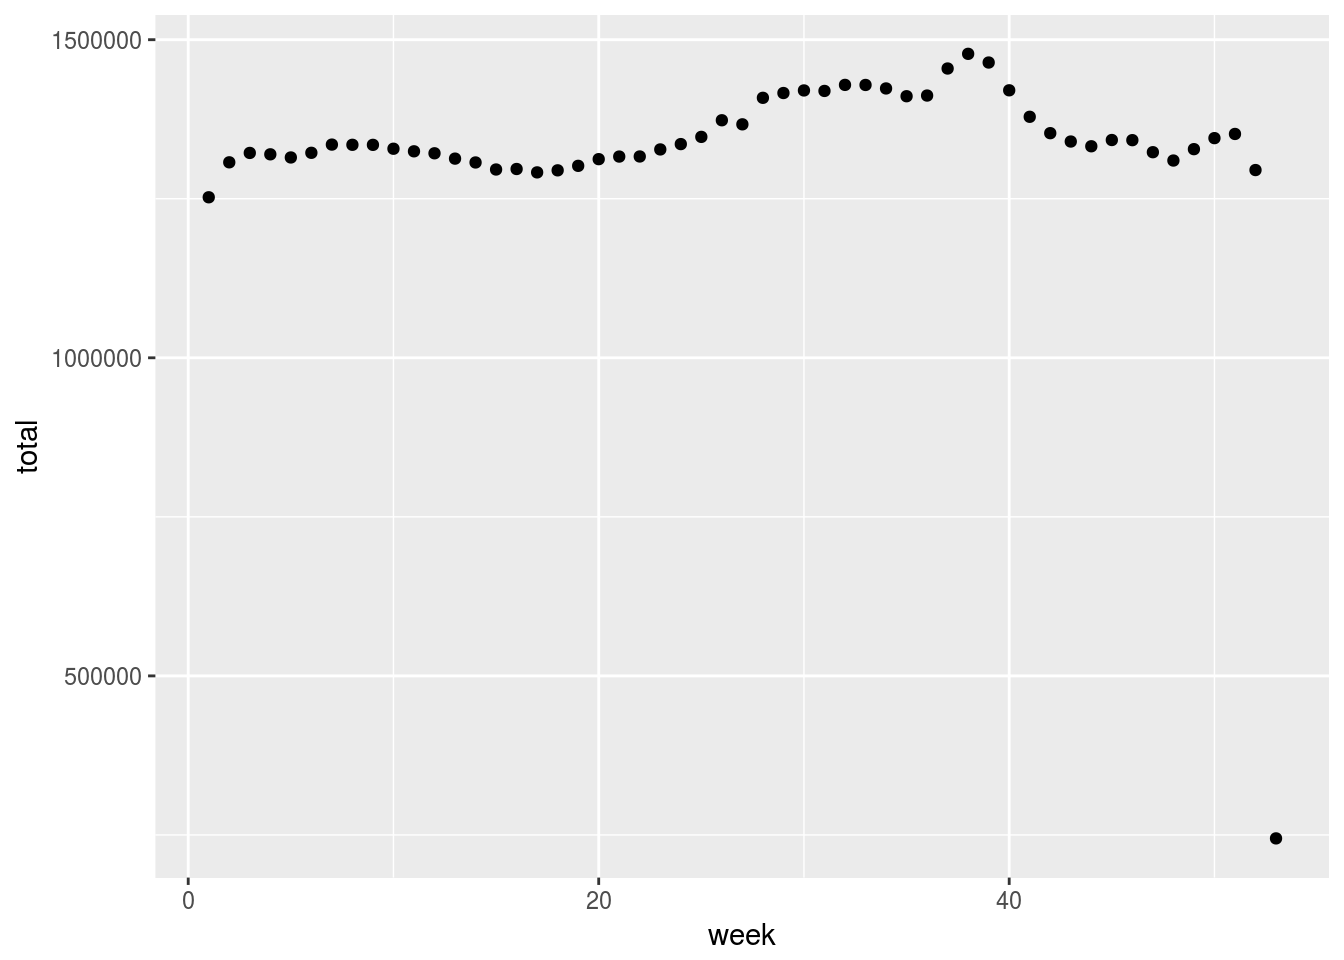
Now by month of the year.
MonthlyBirths <- Birthdays %>%
  mutate(month = month(date)) %>%
  group_by(month) %>%
  summarise(total = sum(births))

MonthlyBirths %>%
  ggplot(aes(x=month, y = total)) + geom_point()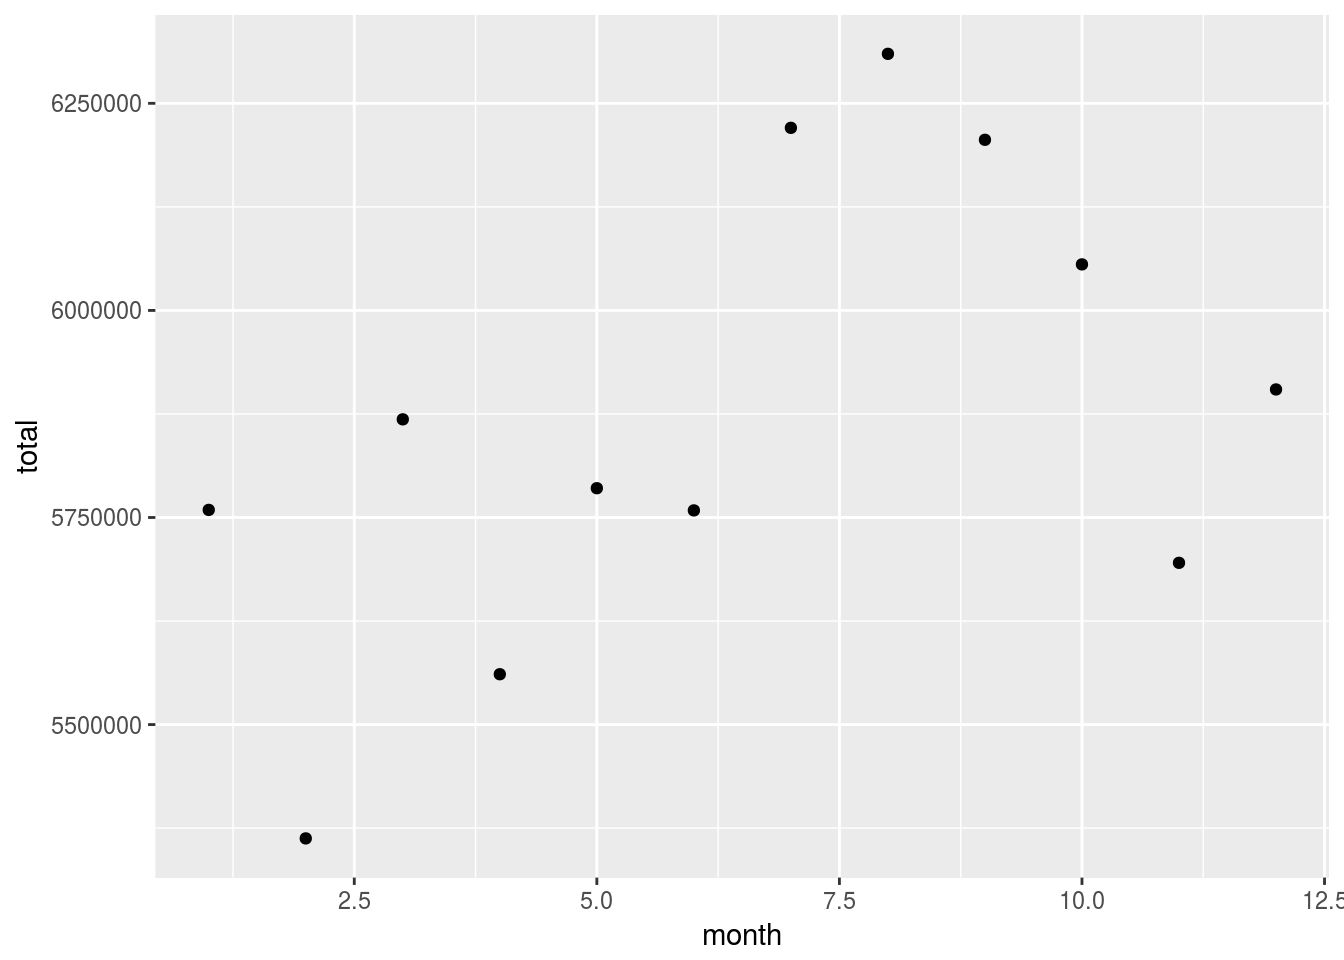
Here we plot by day of the year.
YDailyBirths <- Birthdays %>%
  mutate(yday = yday(date)) %>%
  group_by(yday) %>%
  summarise(total = sum(births))

head(YDailyBirths)
## # A tibble: 6 x 2
## yday total
## <dbl> <int>
## 1 1 160369
## 2 2 169896
## 3 3 180036
## 4 4 182854
## 5 5 184145
## 6 6 186726YDailyBirths %>%
ggplot(aes(x=yday, y = total)) + geom_point()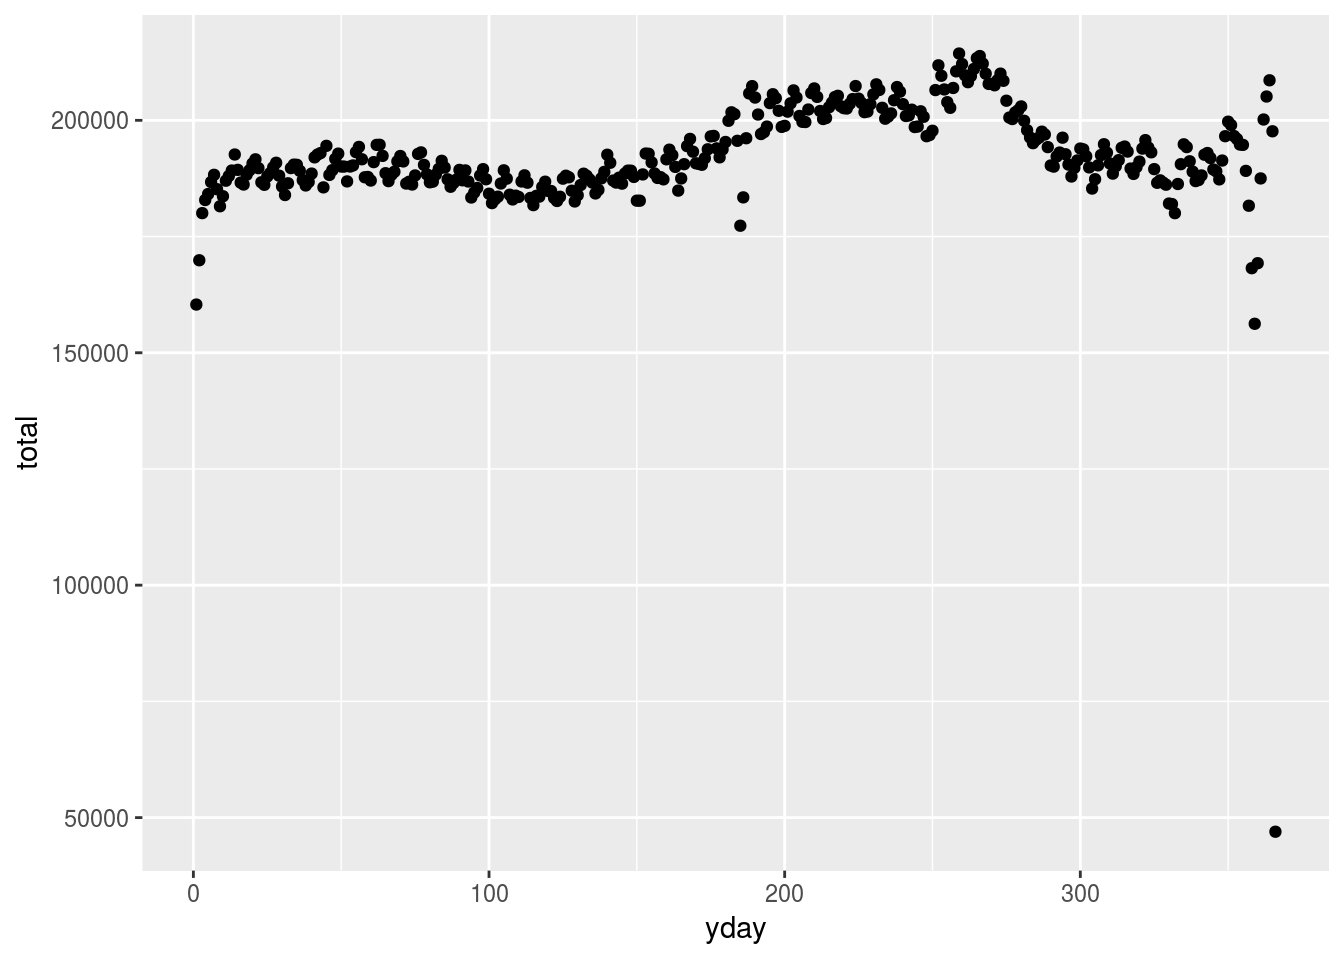
Next by day of the week.
WDailyBirths <- Birthdays %>%
  mutate(wday = wday(date, label = TRUE)) %>%
  group_by(wday) %>%
  summarise(total = sum(births))

head(WDailyBirths)
## # A tibble: 6 x 2
## wday total
## <ord> <int>
## 1 Sun 8647150
## 2 Mon 10372019
## 3 Tues 10813928
## 4 Wed 10533539
## 5 Thurs 10434966
## 6 Fri 10593324WDailyBirths %>%
ggplot(aes(x=wday, y = total)) + geom_point()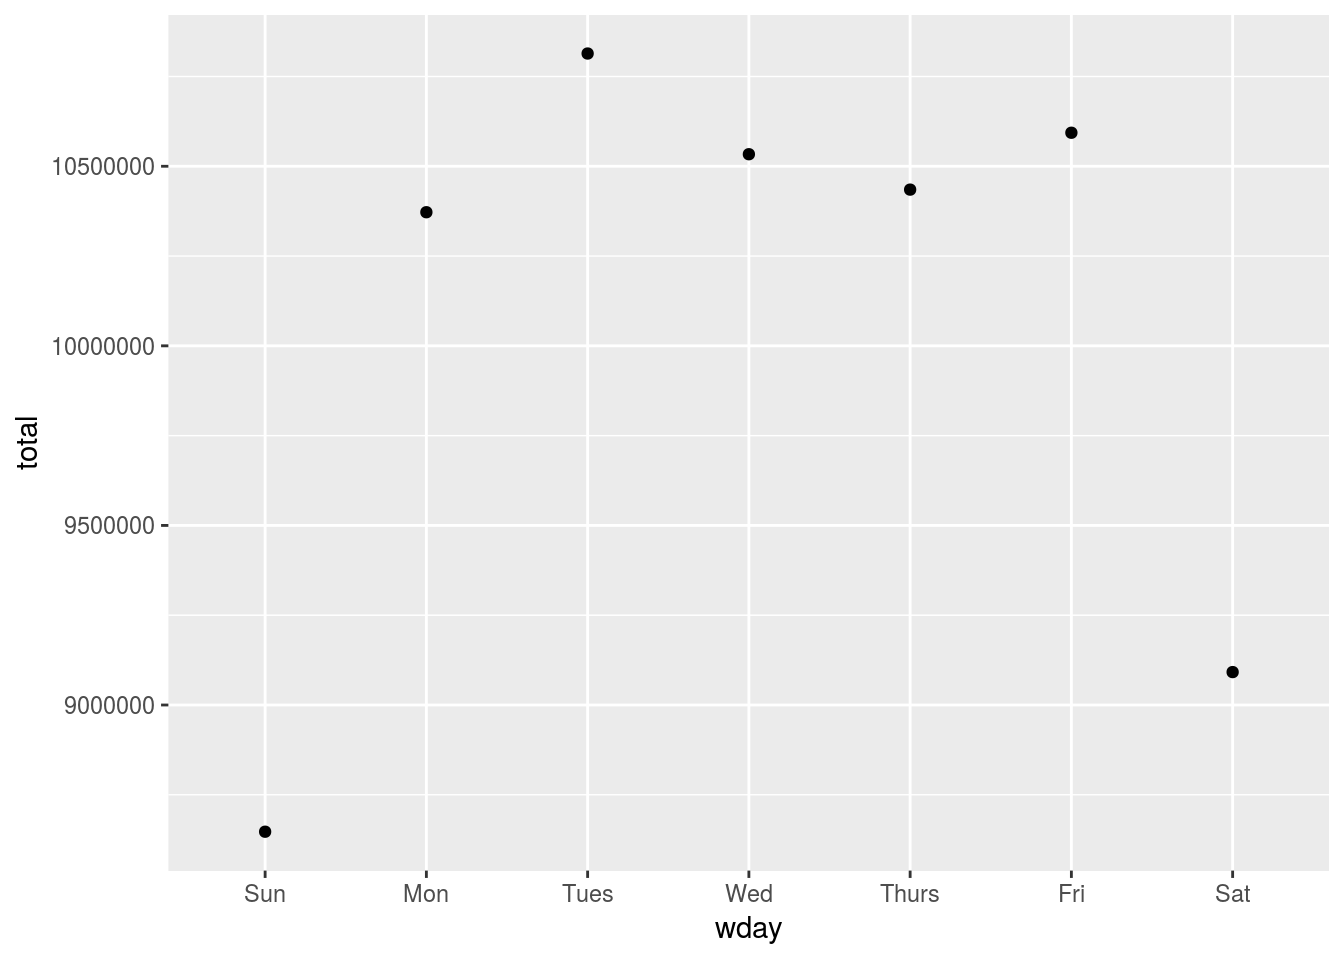
For the remainder of this document, we restrict to the year 1980. First we graph by day of the week for this period.
MyYear <- DailyBirths %>%
  filter(year(date) == 1980) %>%
  mutate(week_day = wday(date, label = TRUE))

MyYear %>%
  ggplot(aes(x=date, y = total, color=week_day)) + geom_line()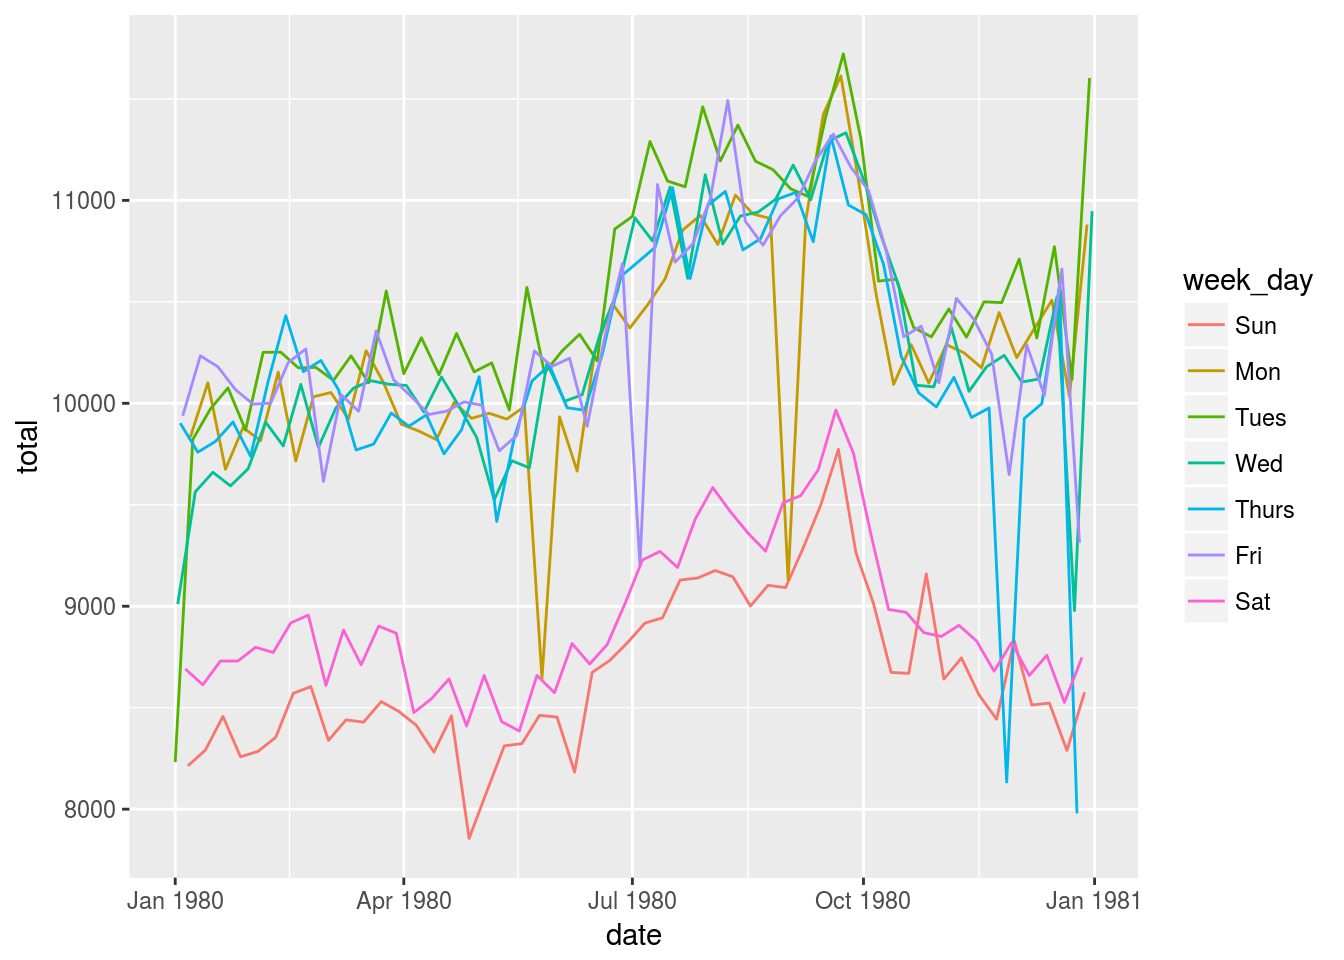
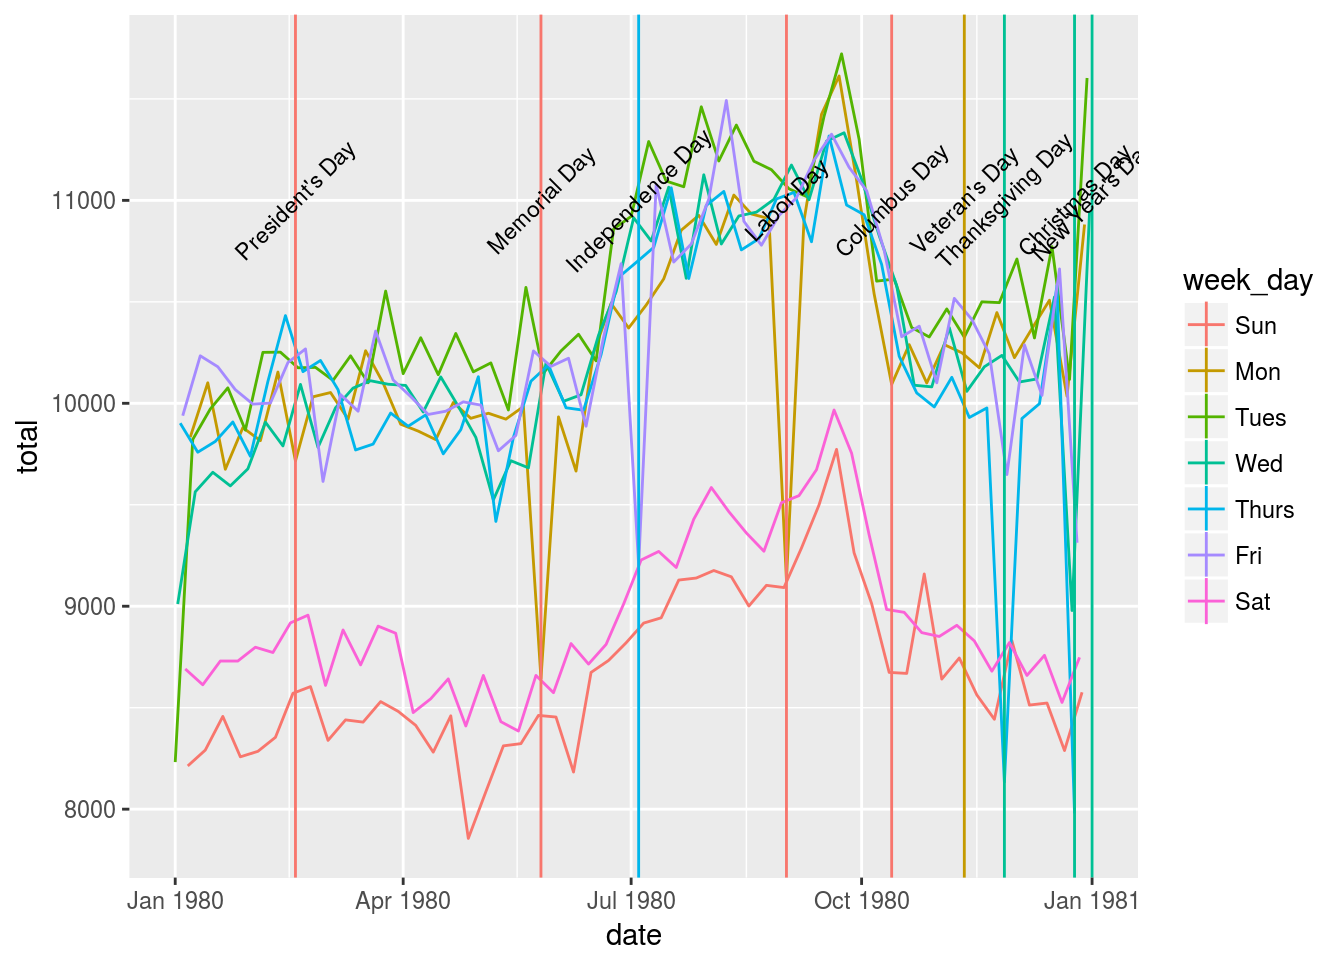
Finally we read in a list of holidays and overlay that information with our plot.
Holidays <- read.csv("http://tiny.cc/dcf/US-Holidays.csv", stringsAsFactors = FALSE) %>%
  mutate(date = as.POSIXct(dmy(date))) %>%
  mutate(week_day = wday(date, label = TRUE)) %>%
  filter(year(date) == 1980)

MyYear %>%
  ggplot(aes(x=date, y = total, color=week_day)) +
    geom_line()  +
    geom_vline(data = Holidays, aes(xintercept = as.numeric(date), color = week_day)) +
    geom_text(data = Holidays, mapping=aes(x = date, y = 11000, label = holiday), angle = 45, size = 3, color = "black")